PU Prime App
Exclusive deals on mobile


PU Prime App
Exclusive deals on mobile
글로벌 시장을 한 손으로 거래하세요
우리의 거래 모바일 앱은 대부분의 모바일 기기와 호환됩니다. 지금 앱을 다운로드하고 언제 어디서나 인터넷이 있는 환경이라면 PU Prime과 거래를 시작하실 수 있습니다.


12 March 2024,05:43
Trading Knowledge
12 March 2024, 05:43


* Poor ISM PMI readings put pressure on dollar strength.
* Traders’ eyes on Tokyo Core CPI due tomorrow to gauge the Yen’s strength.
* OPEC+ will extend oil supply cuts to the second quarter of 2024 to avert a global surplus.
Last week’s release of ISM PMI readings, which fell short of market expectations, triggered a notable decline in dollar strength. This downturn in the dollar catalysed an improvement in risk appetite, propelling the U.S. equity markets to record highs. Commodity prices, including gold, which reached its peak since last November, benefited from the softer dollar environment. Additionally, the decision by OPEC+ to extend its oil supply cuts into the second quarter of 2024 further boosted oil prices.
In the cryptocurrency realm, anticipation of the upcoming Bitcoin halving event, which reduces the reward for miners thus potentially decreasing BTC supply, has positioned Bitcoin prices on a trajectory toward its all-time high of $68,986. This event underscores the intricate dynamics between supply mechanisms and market valuations in the digital asset space.
Current rate hike bets on 20th March Fed interest rate decision:
Source: CME Fedwatch Tool
0 bps (95%) VS -25 bps (5%)
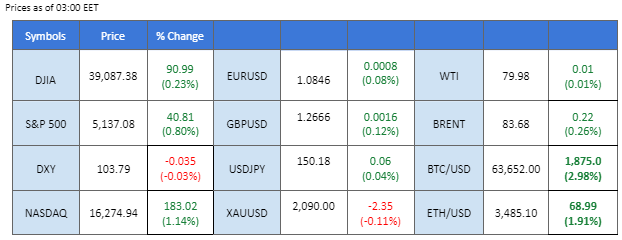
Prices as of 03:00 EET
(MT4 System Time)
N/A
Source: MQL5
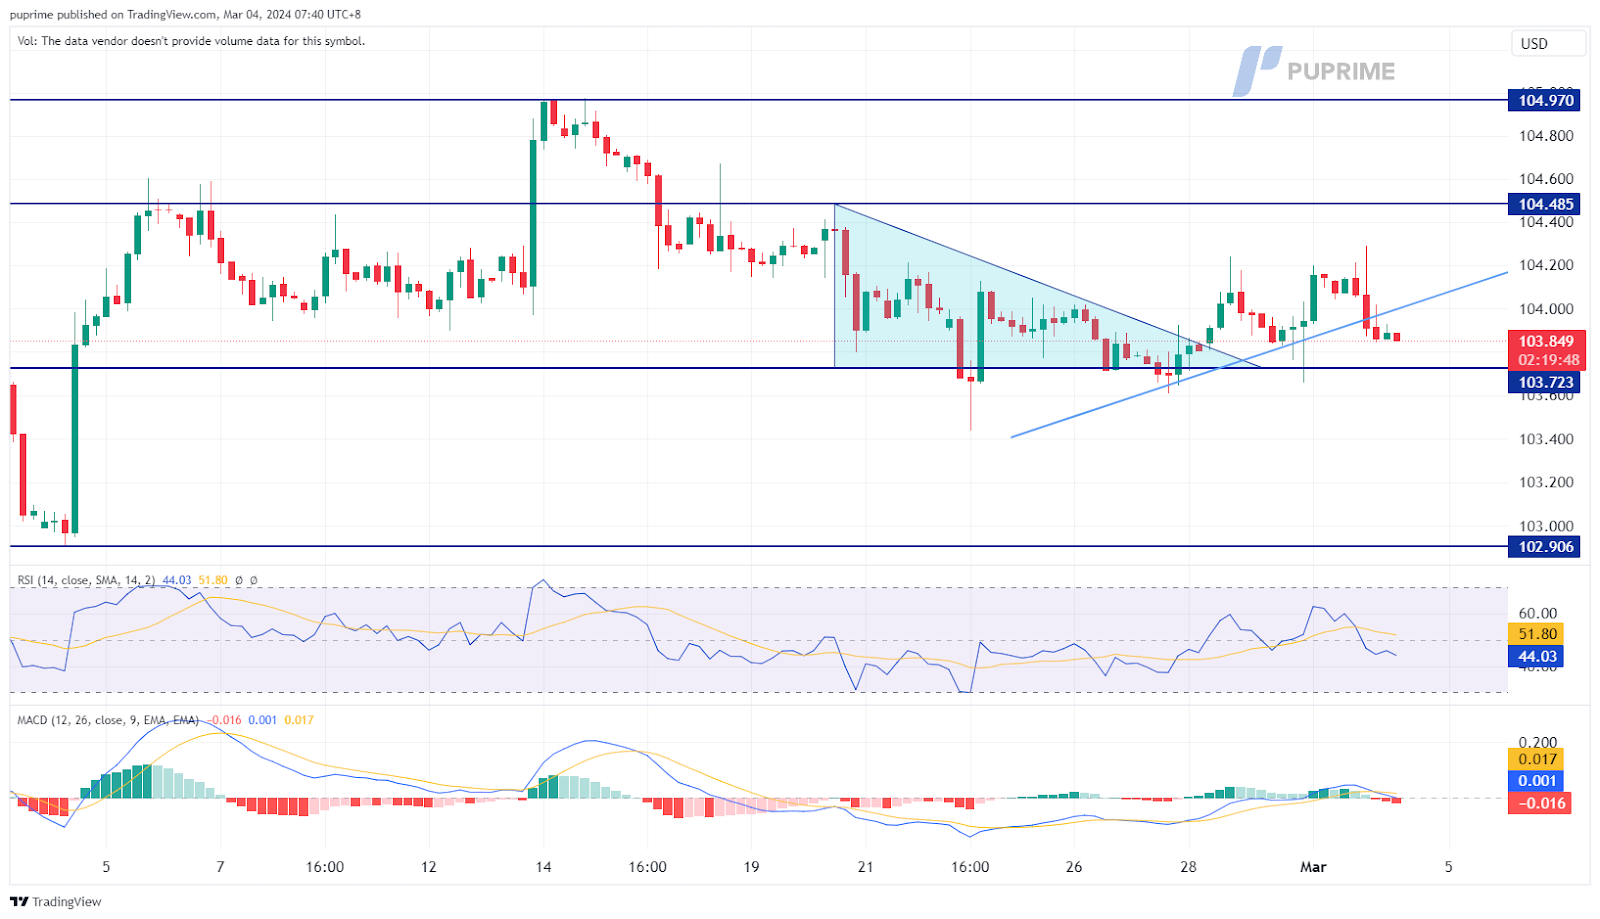
The Dollar Index faced a decline last Friday as the market’s risk sentiment underwent a shift. Discouraging ISM manufacturing PMI readings weighed on the dollar, prompting investors to sell the currency and turn their attention to riskier assets. Throughout the upcoming week, several members of the Federal Reserve are scheduled to deliver speeches. These addresses are anticipated to provide insights into the Fed’s potential monetary moves, influencing the trajectory of the dollar’s strength.
The Dollar Index has declined but has found support at near 103.85, suggesting the bullish trend remains intact. The RSI continues to flow near the 50 levels while the MACD hovering in between the zero line gives a neutral signal for the dollar index.
Resistance level: 104.50, 104.95
Support level: 103.70, 102.90
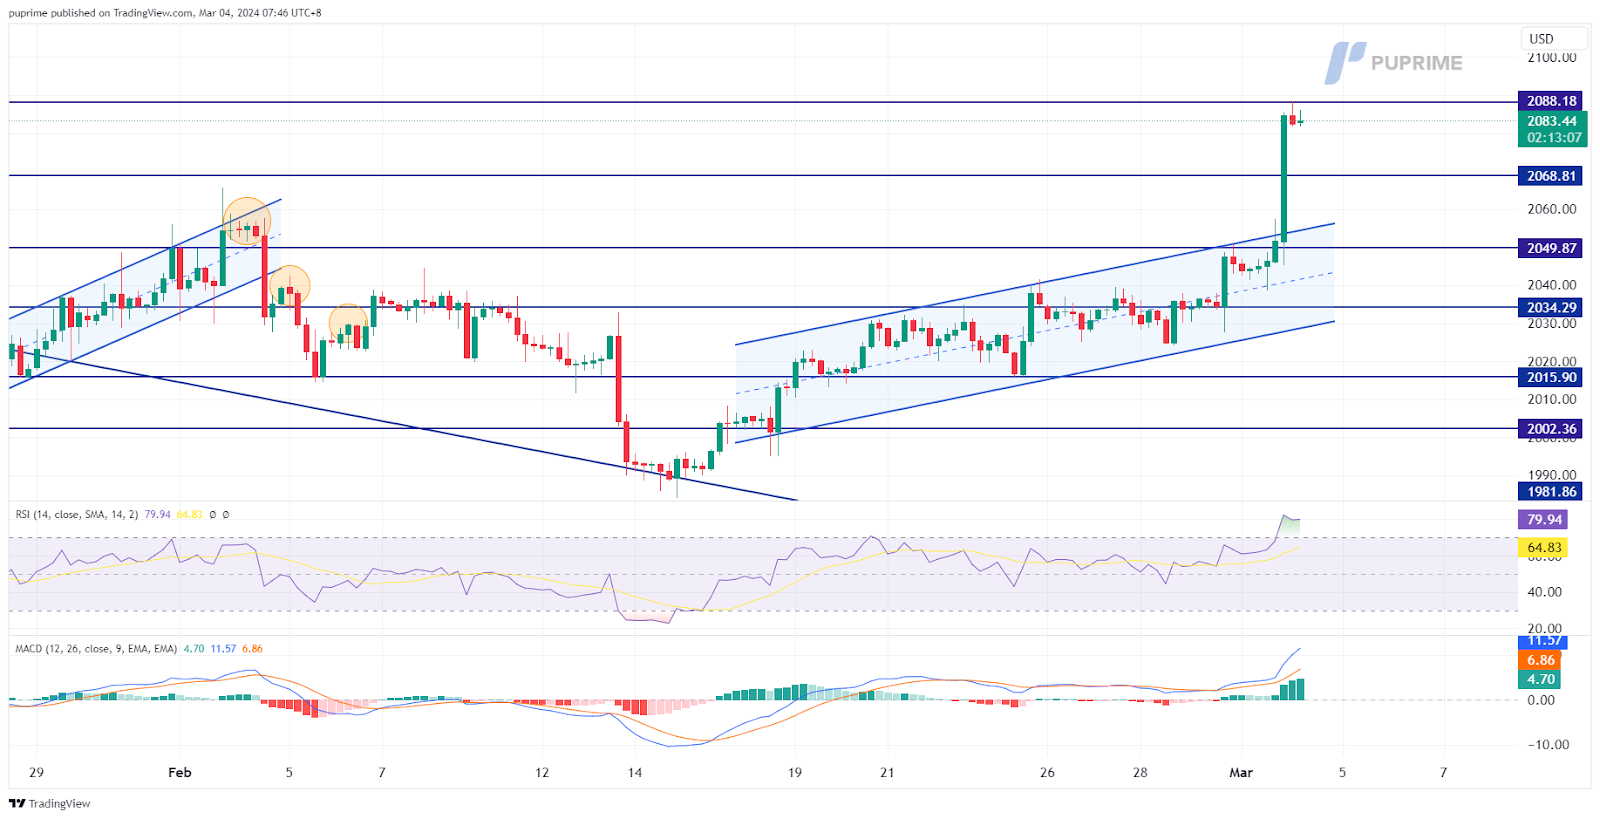
Gold prices experienced a substantial surge, reaching their highest level since December. The weakened dollar, influenced by the latest PCE reading aligning with market expectations and lower than the previous figure, contributed to the bullish momentum in gold. Investors closely monitored the ongoing ceasefire talks in Cairo, Egypt, amidst escalating tensions in the Middle East, adding an additional layer of complexity to the precious metal’s movements.
Gold prices have broken above the uptrend channel and gained an early 2% in the last session, suggesting that gold prices are trading with strong bullish momentum. The RSI has broken into the overbought zone, while the MACD rebound from above the zero line suggests the bullish momentum is strong.
Resistance level: 2088.00, 2118.00
Support level: 2068.80, 2049.90
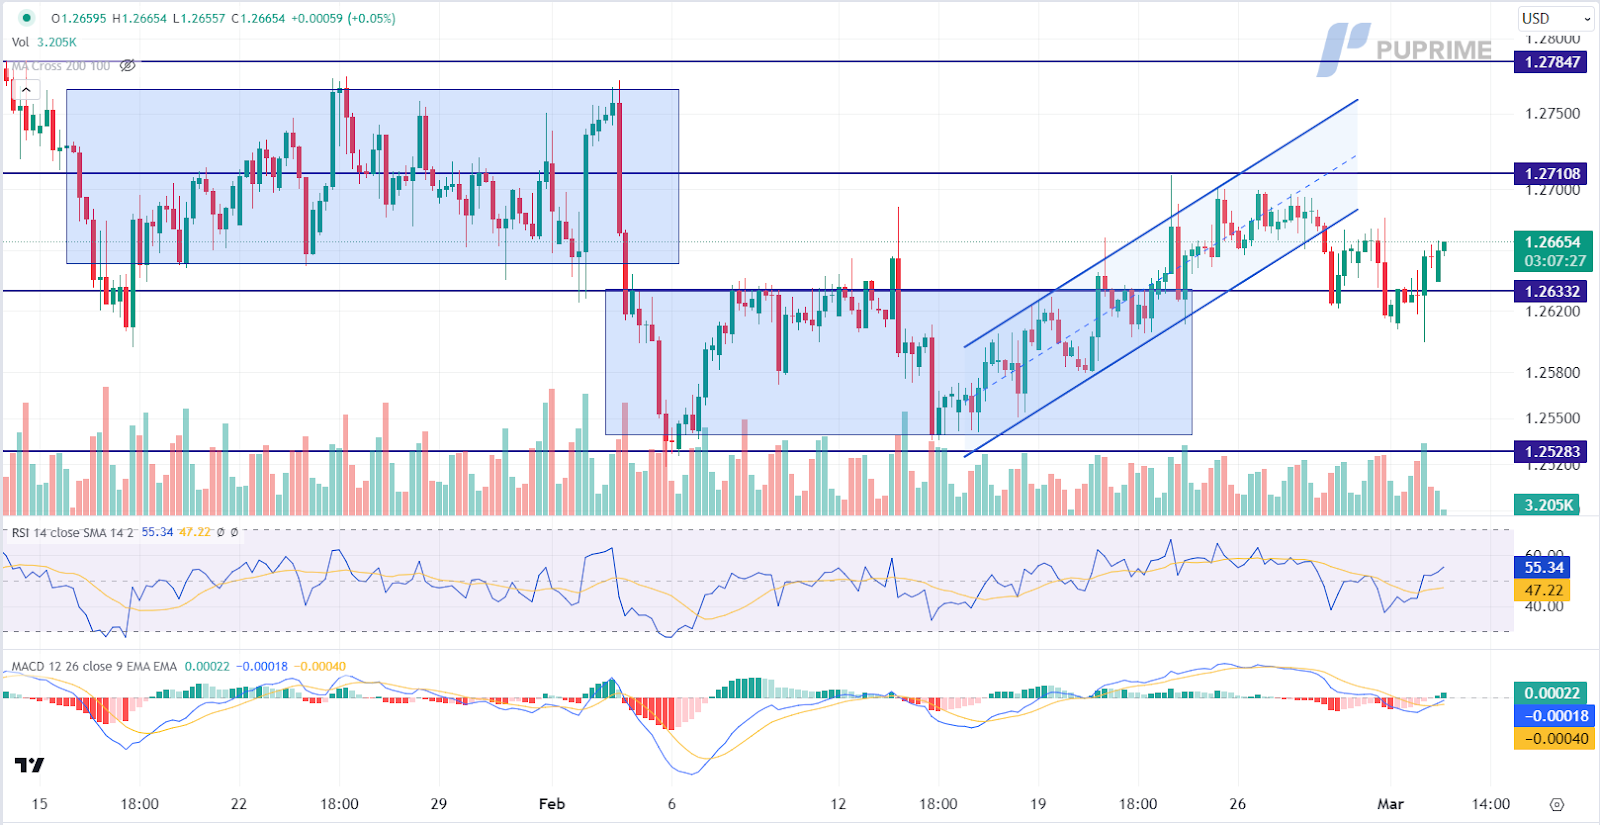
GBP/USD staged a rebound from support levels amid a weakening US Dollar, triggered by disappointing ISM Manufacturing PMI data. Despite recent economic challenges, certain Fed members maintain a hawkish stance. San Francisco Fed President Mary Daly cautions against hasty rate cuts, emphasising potential risks to economic performance. Concurrently, Cleveland Fed President Loretta Mester dismisses expectations of a prolonged disinflation trend from the previous year, reinforcing confidence in the ongoing positive trajectory of the US economy and indicating a reluctance to implement earlier interest rate cuts.
GBP/USD is trading higher following the prior rebound from the support level. MACD has illustrated increasing bullish momentum, while RSI is at 55, suggesting the pair might extend its gains since the RSI stays above the midline.
Resistance level:1.2710, 1.2785
Support level: 1.2635, 1.2530
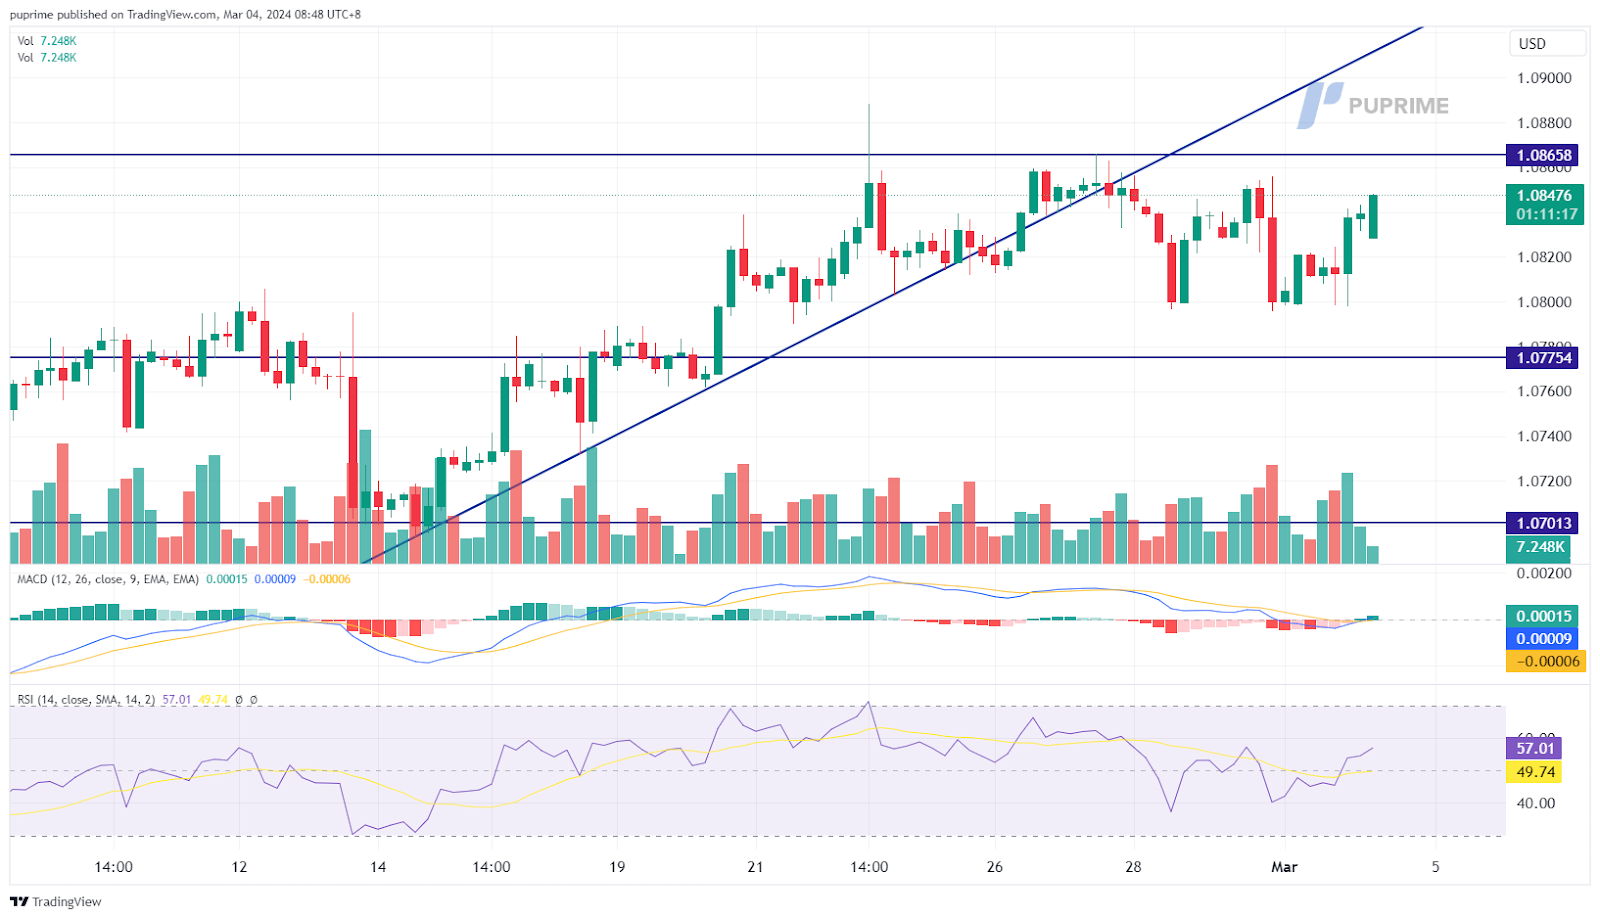
The EUR/USD pair has discovered a support base around 1.0800 levels, initiating a rebound and making strides to surpass its prior high. The surge is predominantly attributed to the dollar’s depreciation, prompted by lacklustre U.S. PMI readings that led investors to shed dollar positions. Attention is now firmly fixed on the European Central Bank’s (ECB) upcoming interest rate decision scheduled for this Thursday, with market expectations leaning toward the maintenance of unchanged interest rates.
EUR/USD is supported at above 1.0800 and recorded a rebound, suggesting the buying power is gaining. The MACD is hovering in between the zero line while the RSI flowing near the 50 level suggests a neutral signal for the pair.
Resistance level: 1.0865, 1.0954
Support level: 1.0775, 1.0770
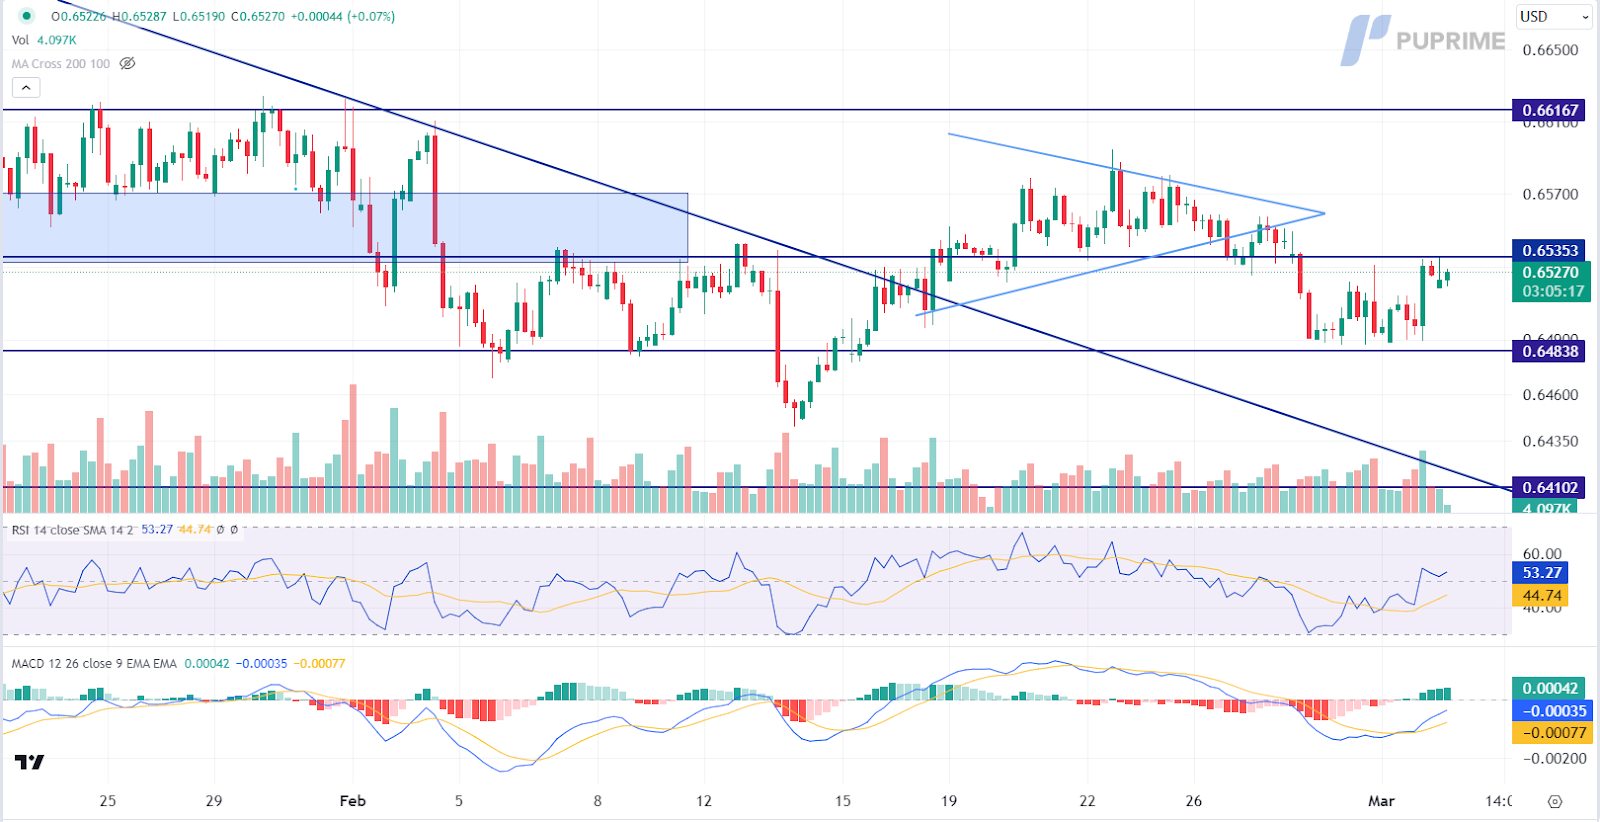
AUD/USD remains range-bound amid a weakening US Dollar, providing support for the pair. However, the Australian dollar faces challenges due to lower-than-expected economic performance in Australia. Consumer price inflation in January stagnates at a two-year low, contributing to expectations of unchanged interest rates. Investors await crucial Australian data releases, including the Services Purchasing Managers Index (PMI) for February and Gross Domestic Product (GDP) for Q4 2023, for additional trading signals.
AUD/USD is trading higher while currently testing the resistance level. MACD has illustrated increasing bullish momentum, while RSI is at 53, suggesting the pair might extend its gains after breakout since the RSI stays above the midline.
Resistance level: 0.6535, 0.6615
Support level: 0.6484, 0.6410
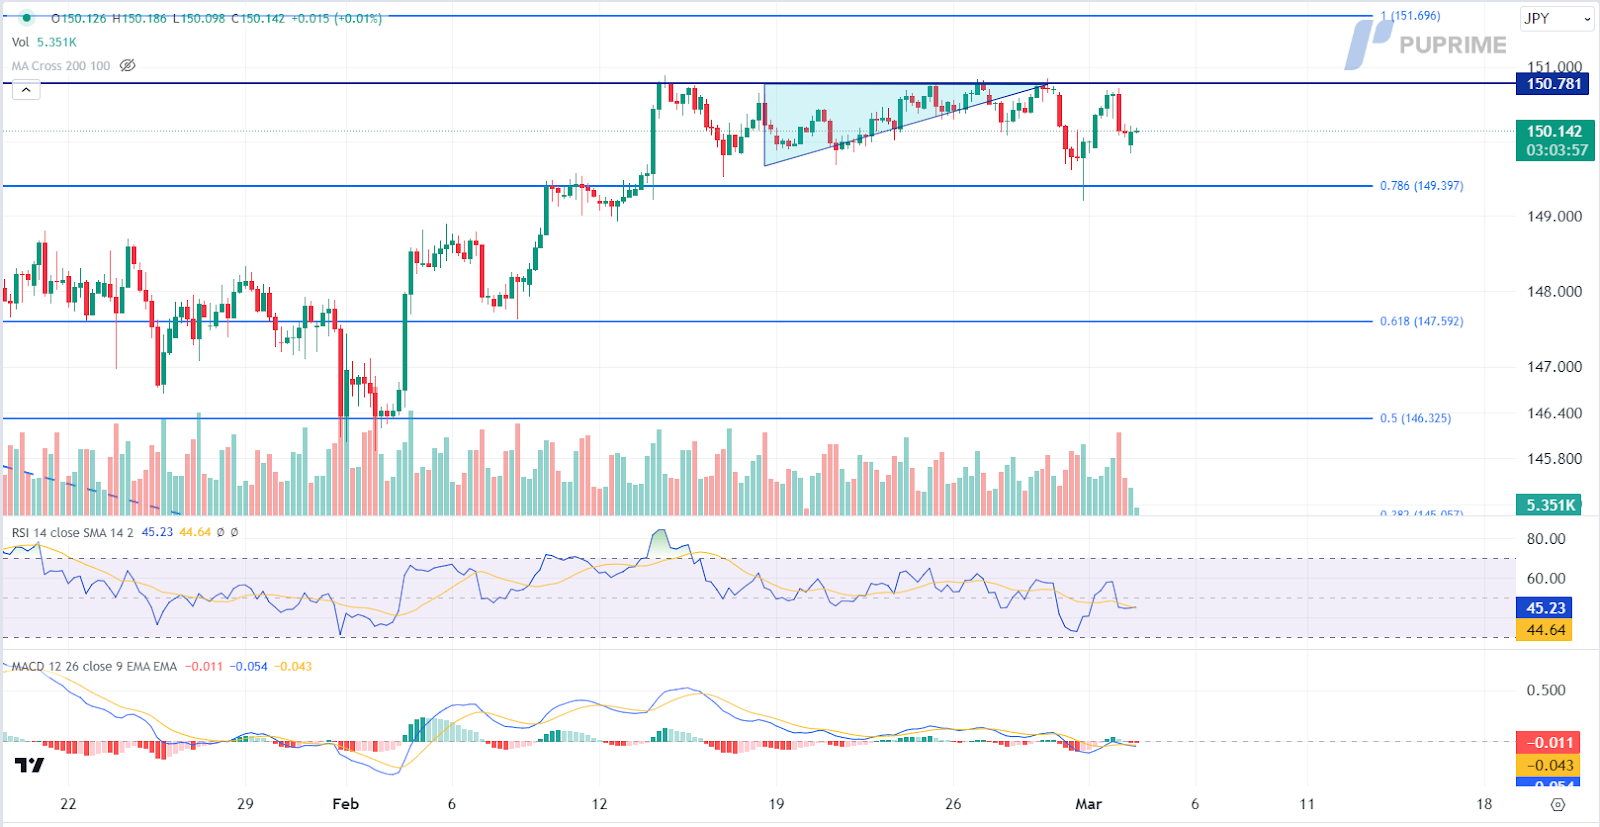
USD/JPY experiences uncertainty due to mixed monetary policy statements from Bank of Japan members. While Hajime Takata signals a potential exit from ultra-loose policy with the inflation target in sight, Governor Kazuo Ueda provides a contradictory view, emphasising the need for confirmation in a positive wage-inflation cycle. This mixed sentiment continues to fuel uncertainty for the USD/JPY pair.
USD/JPY is trading lower following the prior retracement from the resistance level. MACD has illustrated increasing bearish momentum, while RSI is at 45, suggesting the pair might extend its losses since the RSI stays below the midline.
Resistance level: 150.80, 151.70
Support level: 149.40, 147.60
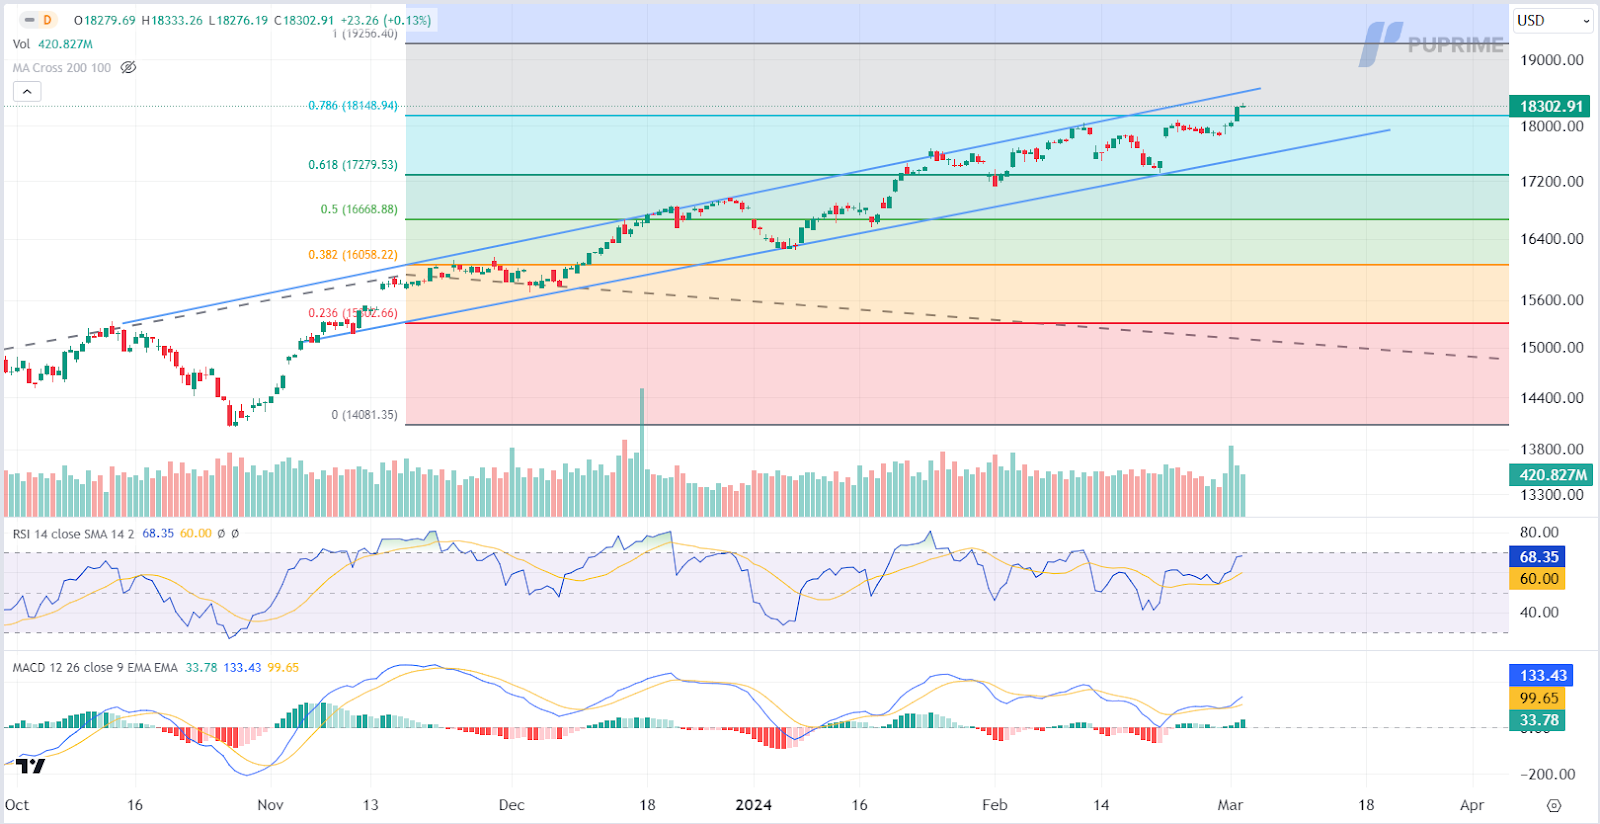
Nasdaq surged to an all-time high above 18,300, reflecting positive sentiment, despite weaker-than-expected US economic data. The increased rate cut expectations, driven by the economic downturn, led to a drop in US Treasury yields, further enhancing the appeal for the US equity market.
Nasdaq is trading higher following the prior breakout above the resistance level. MACD has illustrated increasing bullish momentum, while RSI is at 68, suggesting the index might extend its gains since the RSI stays above the midline.
Resistance level: 19255.00, 20000.00
Support level: 18150.00, 17280.00
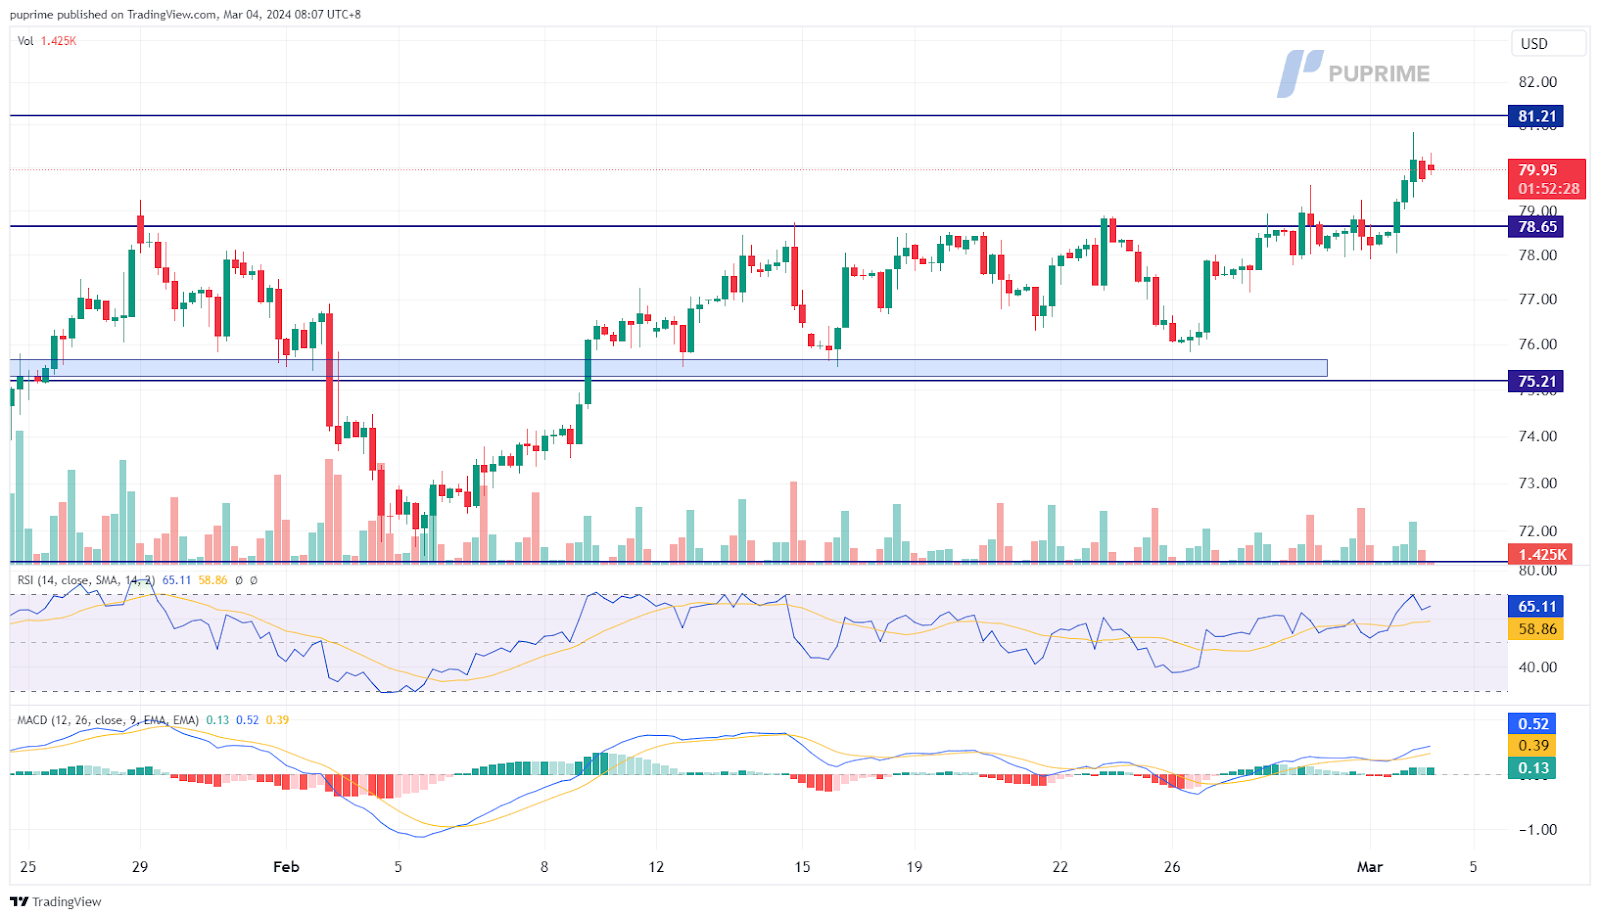
Oil prices have surged past a significant resistance level at 78.65, signalling a robust bullish trend. The upward trajectory is primarily attributed to OPEC+’s strategic decision to extend its supply reduction by 2.2 million barrels per day into the second quarter of 2024, underscoring the cartel’s commitment to stabilising the market and bolstering oil prices.
Oil prices have broken through their strong resistance level, which has been holding the oil prices since last November. The RSI is approaching the overbought zone while the MACD has signs of rebounding from the zero line, suggesting a bullish momentum is forming.
Resistance level: 81.20, 84.10
Support level: 78.65, 75.20

업계 최저 스프레드와 초고속 실행으로 FX, 지수, 귀금속 등을 거래하실 수 있습니다!
PU Prime 앱 - 엣지있게 트레이딩 시작하기


Risk Warning: Trading Contract for Difference (CFD) carries a high level of risk to your capital and may result in losses that exceed your deposits due to leverage. It's important to understand how CFDs work and assess whether you can afford the high risk of losing your money. When acquiring our derivative products, you do not own or have rights in the underlying assets. Past performance is not indicative of future results. The information on this website is general and does not take into account your personal objectives, financial circumstances, or needs. Seek independent advice from qualified experts if necessary, and ensure you fully understand the risks before making any trading decisions.
PU Prime Limited is authorized and regulated by the Financial Services Authority of Seychelles under License No. SD050, with registered address at CT House, Office 1A, Providence, Mahe, Seychelles.
PU Prime Ltd is authorized and regulated by the Financial Services Commission of Mauritius under License No. GB23202672, with registered address at Suite 201 Level 2, The Catalyst Building, 40 Silicon Avenue, Cybercity Ebene, Mauritius.
The information on this website is not intended for residents of certain jurisdictions, including the United States, Singapore, Australia, China, and jurisdictions listed on the FATF and EU/UN sanctions lists. It is not intended for distribution or use where such distribution or use would be contrary to local law or regulation. While the Authority has granted a securities or derivatives investment business licence to the Licensee, it does not endorse the products offered.
Finzero Cap Ltd, registered in the Republic of Cyprus with registration number HE414308 and registered address at 62 Athalassas, Mezzanine, Strovolos 2012, Nicosia, Cyprus.
Copyright © 2024 PU Prime.

Please note the Website is intended for individuals residing in jurisdictions where accessing the Website is permitted by law.
Please note that PU Prime and its affiliated entities are neither established nor operating in your home jurisdiction.
By clicking the "Acknowledge" button, you confirm that you are entering this website solely based on your initiative and not as a result of any specific marketing outreach. You wish to obtain information from this website which is provided on reverse solicitation in accordance with the laws of your home jurisdiction.
Thank You for Your Acknowledgement!
Ten en cuenta que el sitio web está destinado a personas que residen en jurisdicciones donde el acceso al sitio web está permitido por la ley.
Ten en cuenta que PU Prime y sus entidades afiliadas no están establecidas ni operan en tu jurisdicción de origen.
Al hacer clic en el botón "Aceptar", confirmas que estás ingresando a este sitio web por tu propia iniciativa y no como resultado de ningún esfuerzo de marketing específico. Deseas obtener información de este sitio web que se proporciona mediante solicitud inversa de acuerdo con las leyes de tu jurisdicción de origen.
Thank You for Your Acknowledgement!

