PU Prime App
Exclusive deals on mobile


PU Prime App
Exclusive deals on mobile
글로벌 시장을 한 손으로 거래하세요
우리의 거래 모바일 앱은 대부분의 모바일 기기와 호환됩니다. 지금 앱을 다운로드하고 언제 어디서나 인터넷이 있는 환경이라면 PU Prime과 거래를 시작하실 수 있습니다.


28 April 2023,05:52
Daily Market Analysis
28 April 2023, 05:52


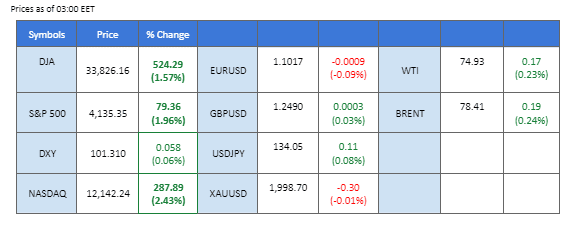
Nasdaq led a Wall Street rally driven by robust earnings from US tech firms, despite concerns over US economic growth. Meta Platforms saw the biggest gains after forecasting quarterly revenue above estimates, citing AI’s impact on boosting ad sales. However, Q1 GDP growth fell short of predictions, while initial jobless claims beat expectations. The US dollar remained flat in post-market trading, while safe-haven assets like gold experienced a selloff. Oil prices steadied as Russian Deputy Prime Minister Alexander Novak alleviated supply glut concerns, and the risk-on sentiment in world markets provided bullish momentum on this black commodity. Investors are closely monitoring the PCE Index for clues on future interest rate movements.
Current rate hike bets on 3rd May Fed interest rate decision:
Source: CME Fedwatch Tool
0 bps (13%) VS 25 bps (87%)
The US Dollar traded flat amid mixed economic data. The US Commerce Department reported that economic growth had slowed more than anticipated in Q1, with the Real Gross Domestic Product (GDP) increasing at an annual rate of 1.10%, down from the previous reading of 2.60%. This figure fell short of economists’ prediction of 2.0%. Despite this, there was positive news as US Initial Jobless Claims fell to 230,000 from the previous reading of 246,000, surpassing market expectations of 248,000. Meanwhile, the upbeat financial reports from major technology firms sparked risk-on sentiment in the global financial market, prompting safe-haven assets such as the US Dollar to experience selloff.
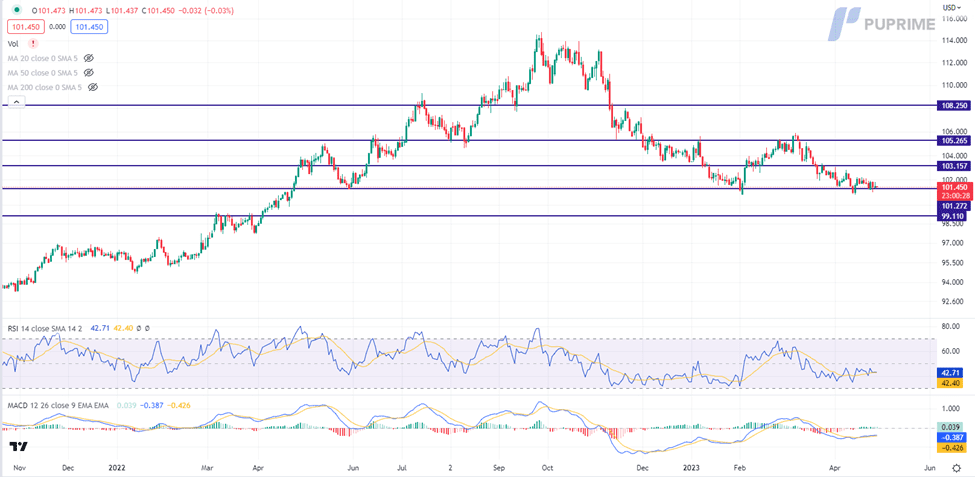
The Dollar Index is trading lower while currently testing the support level. MACD has illustrated diminishing bullish momentum, while RSI is at 42, suggesting the index will extend its losses after breakout since the RSI stays below the midline.
Resistance level: 103.15, 105.25
Support level: 101.25, 99.10
Gold prices dropped because of the risk-on sentiment that was sparked by the optimistic financial reports from major technology firms, despite concerns over the slowing of US economic growth. The Federal Reserve’s preferred inflation gauge, the PCE Index, is closely watched by investors as an indicator of the likelihood of future interest rate movements.
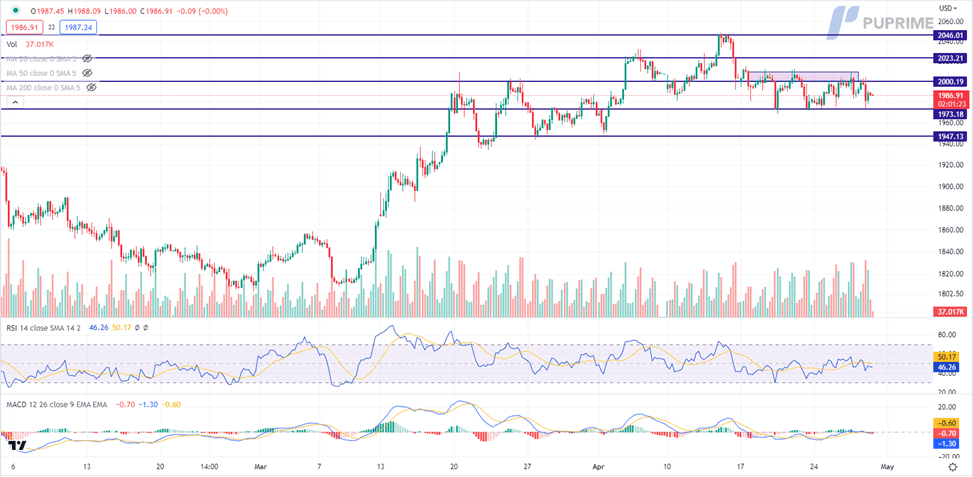
Gold prices are trading lower while currently near the support level. MACD has illustrated increasing bearish momentum, while RSI is at 46, suggesting the commodity might extend its losses after breakout since the RSI stays below the midline.
Resistance level: 2000.00, 2025.00
Support level: 1975.00, 1945.00
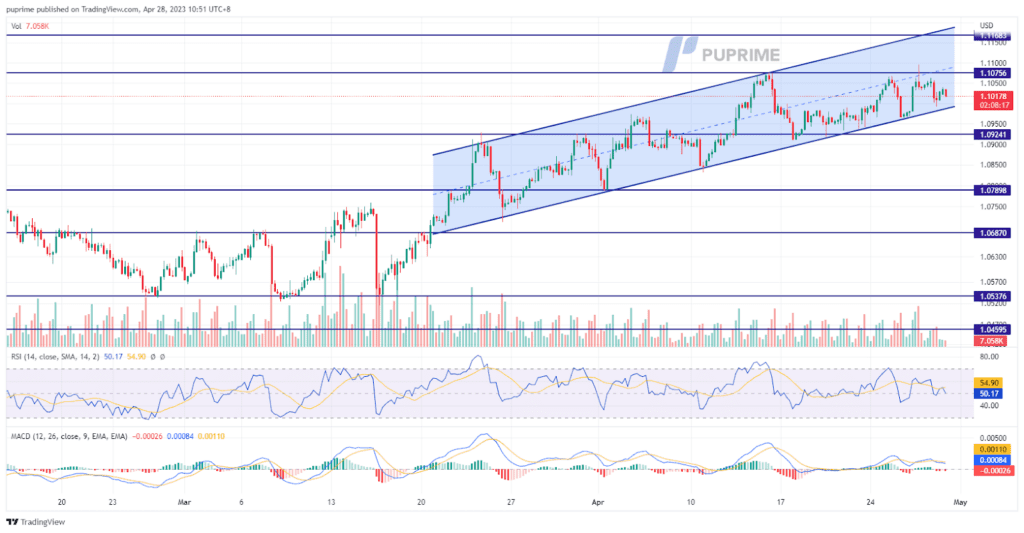
On Thursday, the euro fell by 0.37% to $1.1021 after it rallied to a one-year high against the dollar on Wednesday, supported by a surge in economic sentiment in the Eurozone. According to the European Commission’s sentiment gauge, consumer confidence boosted the reading to 99.3 in April from 99.2 in March, although the outlook for orders caused a slump in the industrial sector. However, despite this weakness, analysts anticipate that the euro region avoided a recession in Q1 due to government support mitigating higher energy costs and hoarded savings.
The euro has shown signs of strength, with the overall trend remaining strong. It may break above the one-year high of $1.1095 if the bullish momentum continues. The MACD indicator trades above the zero line, indicating a potential bullish trend. The RSI indicator is at 50, suggesting a neutral-bullish momentum. These factors point towards a positive outlook for the euro in the near future.
Resistance level: 1.1075, 1.1168
Support level: 1.0924, 1.0790
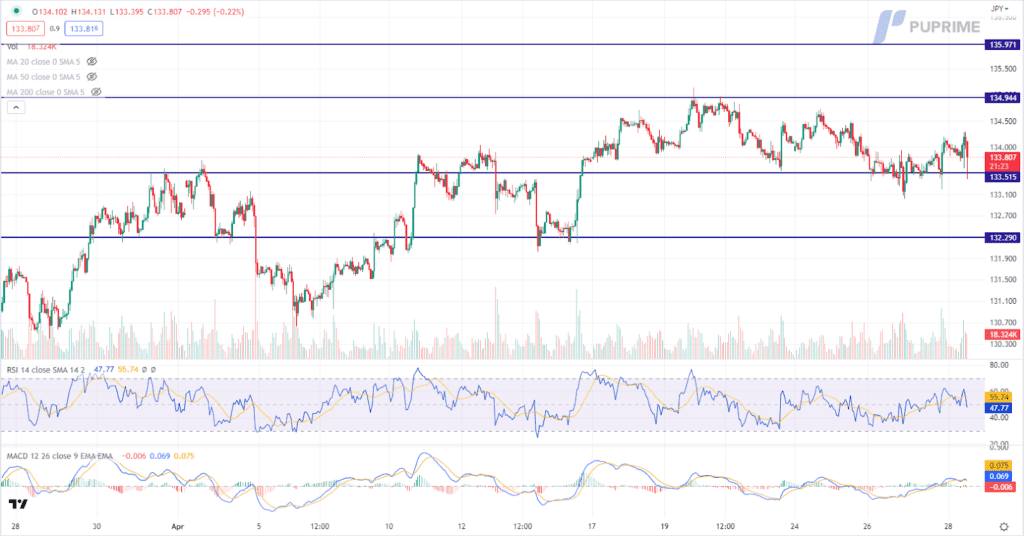
The Japanese yen has recently experienced significant volatility in response to several major events in the region. In April, core consumer inflation in Japan’s capital surged to 3.5%, surpassing market expectations and exceeding the Bank of Japan’s (BoJ) 2% target. This unexpected uptick has prompted speculation that the BoJ may pause its expansionary monetary policy, causing the yield on the 10-year Japanese government bond to rise significantly. Looking ahead, the BoJ will discuss the possibility of conducting a comprehensive examination of its past monetary easing measures and revising its guidance on the future path. As uncertainty continues to loom over Japan’s monetary policy, investors are advised to exercise caution and remain vigilant of any developments that may impact the yen’s value.
USDJPY is trading lower while currently testing the support level. MACD has illustrated increasing bearish momentum, while RSI is at 48, suggesting the pair might extend its losses after breakout since the RSI stays below the midline.
Resistance level: 134.95, 135.95
Support level: 133.50, 132.30
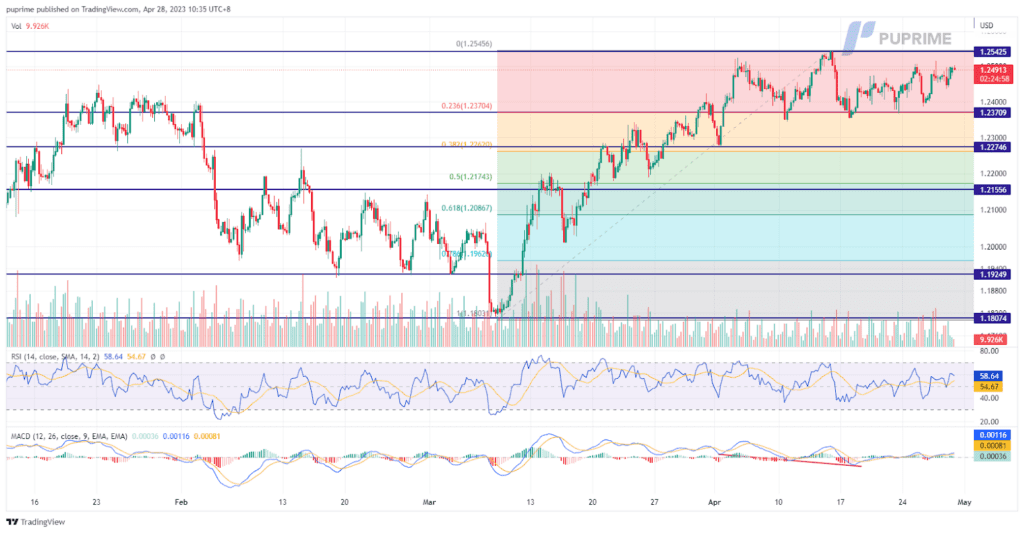
The pound stabilised against the dollar on Thursday, following two days of volatility that kept it close to a 10-month high. The pair remained flat at $1.2492 after rising 0.48% on Wednesday and falling 0.58% on Tuesday amid concerns about the U.S. banking sector and the debt ceiling. Market analysts suggested that recent dollar troubles could lead to larger central bank responses in the U.S.. At the same time, the Bank of England’s upcoming meeting may present a challenge due to high inflation in Britain.
Despite two volatile days, the overall trend for the pound remains strong, with the currency hovering just below a 10-month peak against the dollar. The MACD indicator trades in a neutral-bullish momentum, and the RSI is at 58, signalling a bullish trend for the pound.
Resistance level: 1.2545, 1.2645
Support level: 1.2370, 1.2262
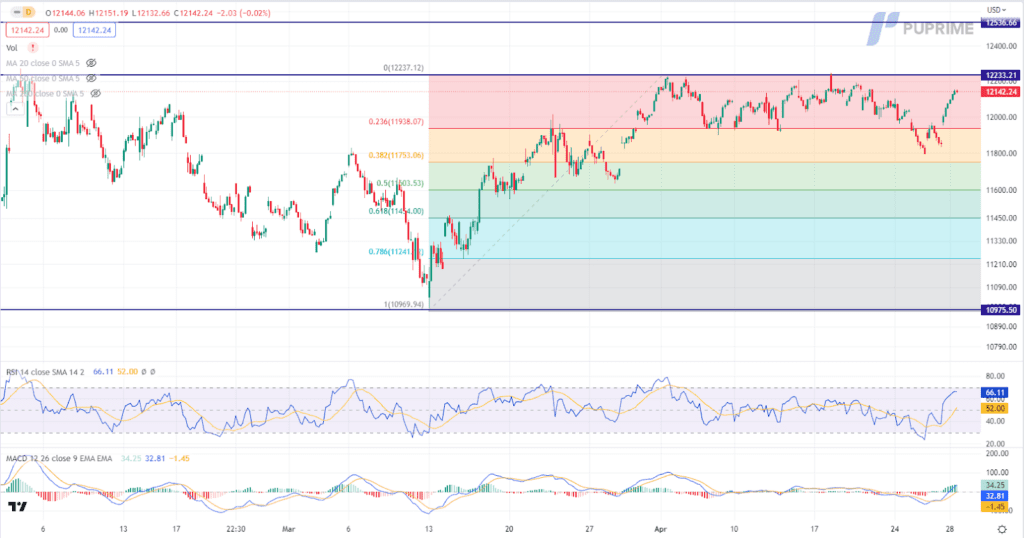
Nasdaq spearheaded a Wall Street rally on Thursday, buoyed by robust quarterly reports from leading US technology firms. Despite concerns over slowing US economic growth, the Meta Platform saw the biggest gains, with a 13.9% surge to its highest level in over a year, after forecasting quarterly revenue above estimates. CEO Mark Zuckerberg attributed the success to AI, which increased traffic to its services and boosted ad sales
Nasdaq is trading higher while currently testing the resistance level. However, MACD has illustrated diminishing bullish momentum, while RSI is at 66, suggesting the index might enter overbought territory.
Resistance level: 12235.00, 12535.00
Support level: 11940.00, 11755.00
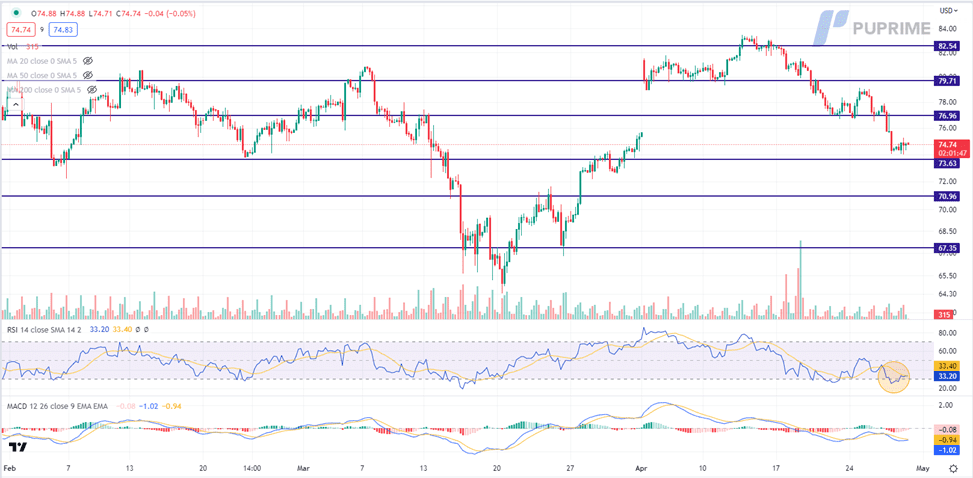
Oil prices steadied and recouped some of their losses from the previous session following remarks by Russian Deputy Prime Minister Alexander Novak. The high-ranking official claimed that global oil markets were balanced, alleviating concerns of a potential supply glut. Despite OPEC+ not seeing the need for further oil output cuts in the future, Novak emphasised the organisation’s ability to adjust its policy should the future economic outlook remain pessimistic.
Oil prices are trading flat while currently testing the support level. However, MACD has illustrated diminishing bearish momentum, while RSI is at 33, suggesting the commodity might trade higher as technical correction since the RSI rebounded sharply from overbought territory.
Resistance level: 76.95, 79.70
Support level: 73.75, 70.95

업계 최저 스프레드와 초고속 실행으로 FX, 지수, 귀금속 등을 거래하실 수 있습니다!
PU Prime 앱 - 엣지있게 트레이딩 시작하기


Risk Warning: Trading Contract for Difference (CFD) carries a high level of risk to your capital and may result in losses that exceed your deposits due to leverage. It's important to understand how CFDs work and assess whether you can afford the high risk of losing your money. When acquiring our derivative products, you do not own or have rights in the underlying assets. Past performance is not indicative of future results. The information on this website is general and does not take into account your personal objectives, financial circumstances, or needs. Seek independent advice from qualified experts if necessary, and ensure you fully understand the risks before making any trading decisions.
PU Prime Limited is authorized and regulated by the Financial Services Authority of Seychelles under License No. SD050, with registered address at CT House, Office 1A, Providence, Mahe, Seychelles.
PU Prime Ltd is authorized and regulated by the Financial Services Commission of Mauritius under License No. GB23202672, with registered address at Suite 201 Level 2, The Catalyst Building, 40 Silicon Avenue, Cybercity Ebene, Mauritius.
The information on this website is not intended for residents of certain jurisdictions, including the United States, Singapore, Australia, China, and jurisdictions listed on the FATF and EU/UN sanctions lists. It is not intended for distribution or use where such distribution or use would be contrary to local law or regulation. While the Authority has granted a securities or derivatives investment business licence to the Licensee, it does not endorse the products offered.
Finzero Cap Ltd, registered in the Republic of Cyprus with registration number HE414308 and registered address at 62 Athalassas, Mezzanine, Strovolos 2012, Nicosia, Cyprus.
Copyright © 2024 PU Prime.

Please note the Website is intended for individuals residing in jurisdictions where accessing the Website is permitted by law.
Please note that PU Prime and its affiliated entities are neither established nor operating in your home jurisdiction.
By clicking the "Acknowledge" button, you confirm that you are entering this website solely based on your initiative and not as a result of any specific marketing outreach. You wish to obtain information from this website which is provided on reverse solicitation in accordance with the laws of your home jurisdiction.
Thank You for Your Acknowledgement!
Ten en cuenta que el sitio web está destinado a personas que residen en jurisdicciones donde el acceso al sitio web está permitido por la ley.
Ten en cuenta que PU Prime y sus entidades afiliadas no están establecidas ni operan en tu jurisdicción de origen.
Al hacer clic en el botón "Aceptar", confirmas que estás ingresando a este sitio web por tu propia iniciativa y no como resultado de ningún esfuerzo de marketing específico. Deseas obtener información de este sitio web que se proporciona mediante solicitud inversa de acuerdo con las leyes de tu jurisdicción de origen.
Thank You for Your Acknowledgement!

