-
- 거래 조건
- 계좌유형
- 스프레드, 비용 & 스왑
- 입금 & 출금
- 수수료 & 요율
- 거래 시간
-
- 회사소개
- 회사개요
- PU Prime 리뷰
- 공지사항
- 뉴스룸
- PU Prime에 연락하기
- 고객센터
Equity markets advanced and major currencies fluctuated in narrow ranges in the last session. Easing in the banking crisis and perceived lower risk of recession spurred the equity market to trade higher while modest rate hikes from major central banks muted the foreign exchange market. However, several Fed officials have commented that the U.S. central bank will still prioritise taming inflation, while the St. Louis Fed president made mention of the Fed’s peak rate at 5.625%. In addition, the market expects the Australian central bank to pause raising interest rates with the backdrop of banking system uncertainty and fear of recession before the RBA makes its interest rate announcement next week. On the other hand, oil prices gained with the easing of the banking crisis as well as escalated geopolitical tension in the Euro while the Russian president announced the stationing of tactical nuclear weapons in Belarus. Russian officials also claim that the country is close to cutting the crude oil supplies by 500.000 barrels per day and cutting refinery output in April.
Current rate hike bets on 3rd May Fed interest rate decision:
0 bps (88%) VS 25 bps (12%)

Traders worldwide are facing a tumultuous week as the banking crisis looms over the markets. Multiple Federal Reserve officials are set to speak, while a key measure of US inflation is set to be released. Bloomberg Economics predicts a 75% chance of a recession in the third quarter, with US unemployment rates projected to soar to 5.0% by 2024, up from 3.6% reported in February. These projections have caused investors to shift their portfolio towards the safe-haven US dollar, as the markets brace for a potential downturn.
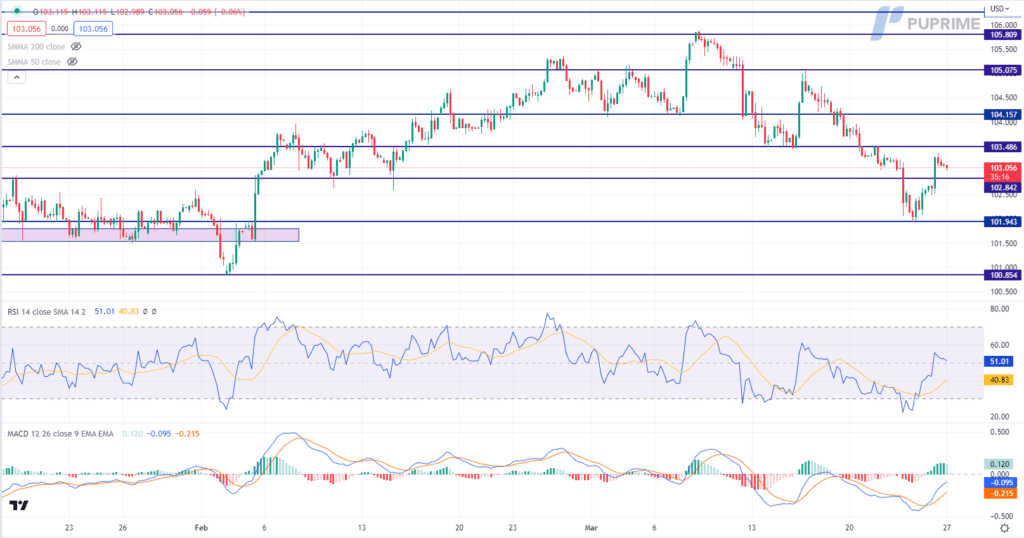
The Dollar Index is trading higher following the prior breakout above the previous resistance level. MACD has illustrated increasing bullish momentum, while RSI is at 51, suggesting the index might extend its gains since the RSI stays above the midline.
Resistance level: 103.50, 105.15
Support level: 102.85, 101.95
Gold prices experienced a technical correction after reaching the significant milestone of $2,000. However, the appeal of the safe-haven asset remains strong in mid-term amidst growing recession risks. Traders worldwide are facing a tumultuous week as the banking crisis continues to loom over the markets. Multiple Federal Reserve officials are expected to speak, and a key measure of US inflation is set to be released. As such, investors are advised to remain vigilant and closely monitor the ongoing developments in the global economy to make informed decisions about their investments in gold.
Gold prices are trading lower while currently testing the support level. MACD has illustrated increasing bearish momentum, while RSI is at 53, suggesting the commodity might extend its losses since the RSI retreated sharply from oversold territory.
Resistance level: 2000.00, 2040.00
Support level: 1975.00, 1955.00
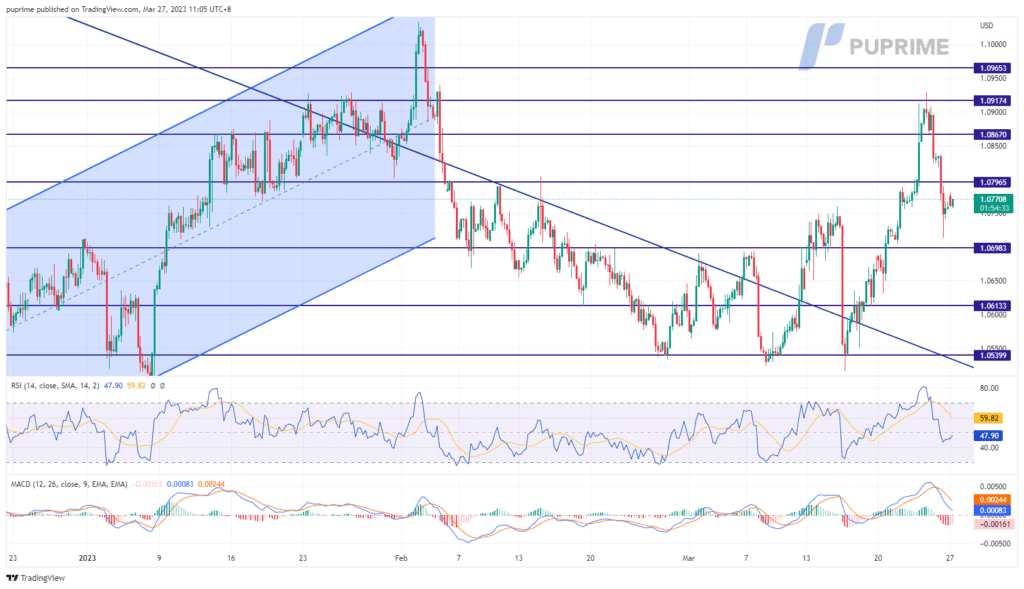
The hammered down by 0.67% in the last session after the pair touched its monthly high at 1.093. The dollar index eased from its previous bearish momentum and rebounded at a key support level of $102. Several Fed officials have commented relatively Hawkish and said they would priorities taming inflation and would not be distracted by the financial system’s stability. The Fed officials made further remarks that the Fed will not pause the monetary tightening program this year and the Fed’s peak rate may go to 5.625%. On the other hand, Christine Lagarde, the ECB chair will be speaking along with the release of Eurozone Year-on-year CPI. Hawkish comments from her and high CPI reading may stimulate the euro to trade higher against the dollar.
The indicators depict a trend reversal for the pair. The RSI has fallen out from the overbought zone heading to the 50-level. The MACD on the other hand, has a convergence above the zero line and is moving downward to the zero line suggesting that the bullish momentum is diminishing.
Resistance level: 1.0796, 1.0867
Support level: 1.0698, 1.0613
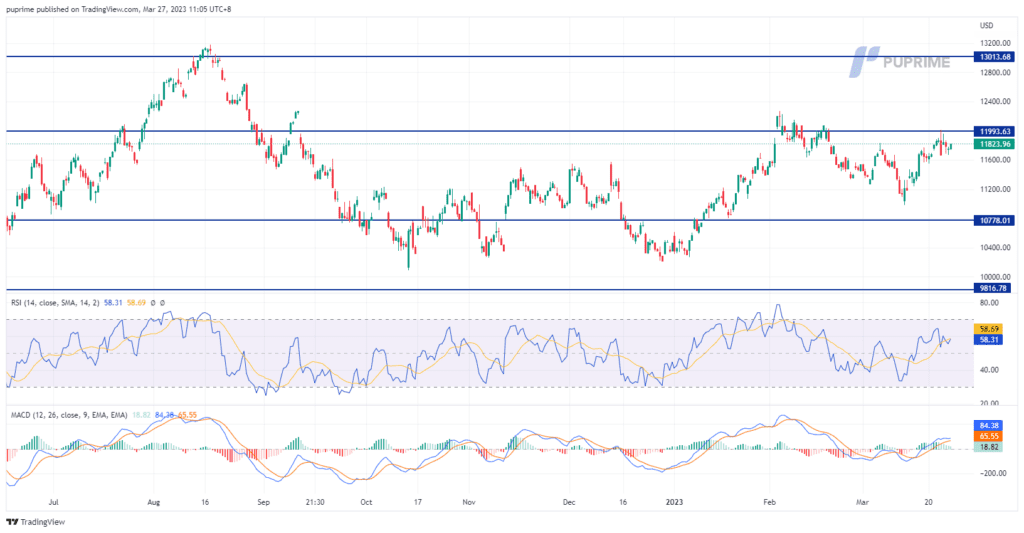
The Nasdaq index rose 0.3% to 11,823 points on Friday. In addition, three regional Fed bank presidents expressed their confidence that the banking system was not facing a liquidity crisis, which led to the decision to implement a 25 basis point policy rate hike on Wednesday. But while the Fed officials continue to see additional rate hikes as a strong possibility, financial markets are now favouring the likelihood of a pause rate hike at the next policy meeting in May. The overall market sentiment remains sceptical, and investors mostly trade cautiously.
The movement of the index remains neutral-bullish. MACD has illustrated neutral-bullish momentum ahead. RSI is at 58, indicating a neutral-bullish momentum in the near term.
Resistance level: 11993, 13013
Support level: 10778, 9816
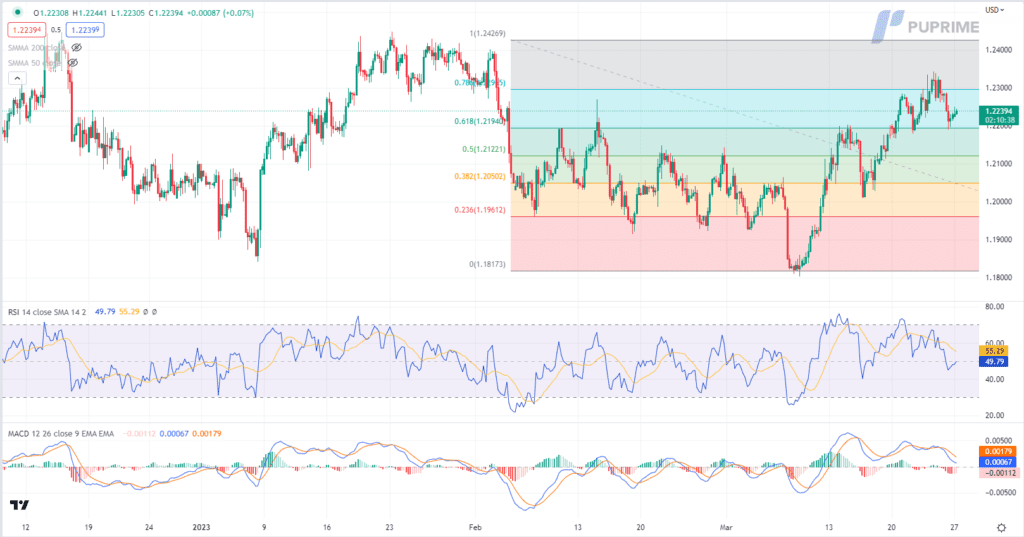
The Pound Sterling faced bearish momentum amidst a series of disappointing economic data releases. The S&P Global/CIPS UK Composite Purchasing Managers’ Index (PMI) – covering both services and manufacturing firms – dropped to 52.2 in March, down from the previous reading of 53.1, and falling short of market expectations of 52.7. While the services’ PMI remained in positive territory at 52.8, the manufacturing PMI slipped to 48.0, marking its eighth month of contraction. These figures have contributed to the negative sentiment surrounding the Pound Sterling.
GBPUSD is trading lower while currently near the support level. MACD has illustrated increasing bearish momentum, while RSI is at 50, suggesting the pair might consolidate within a range between resistance and support level since the RSI stays near the midline.
Resistance level: 1.2295, 1.2425
Support level: 1.2195, 1.2120
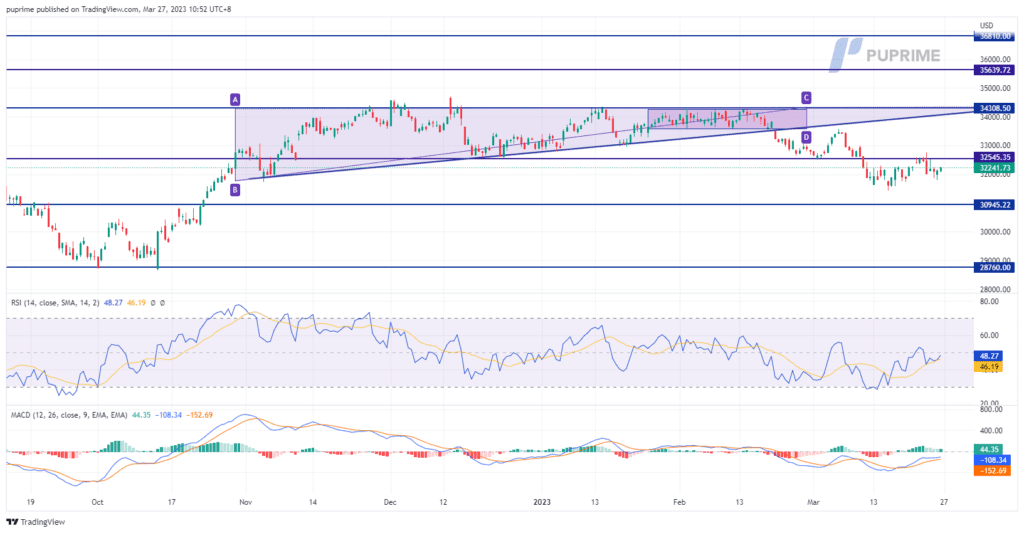
The Dow Jones Industrial Average rose 0.41% to 32,237 points on Friday. Traders are in for another bumpy week, with the banking crisis casting a shadow over markets. On top of that, multiple Federal Reserve officials will speak, a key measure of US inflation is due, and there are renewed geopolitical tensions with Russia to station tactical nuclear weapons in Belarus. Over the weekend, bank turmoil had increased the risk of a US recession. As for now, the market needs more economic data to be released for further trading signals because investors lack confidence.
In the short term, stock markets are likely to trade on the sidelines as investors fear recession risk. MACD has illustrated neutral-bearish momentum. And RSI is at 48, indicating a neutral-bearish momentum ahead.
Resistance level: 32545.00, 34310.00
Support level: 30945.00, 28760.00
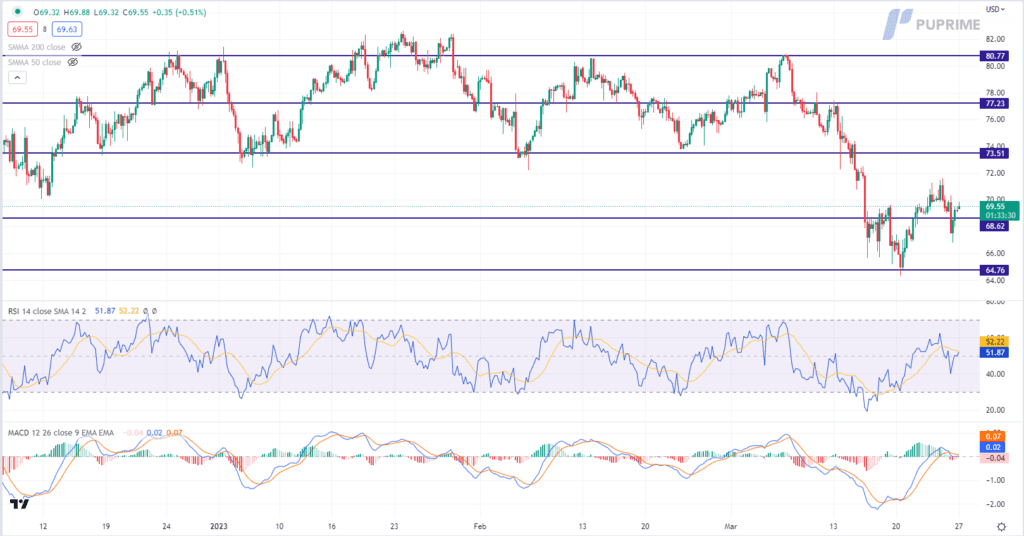
The bearish trend in the oil market persists due to fresh concerns about the banking sector and recession risks. These worries have darkened the demand outlook, exacerbating the negative sentiment towards oil. Additionally, investors remain sceptical about China’s economic recovery, despite recent data showing signs of improvement. Rising unemployment and a slump in real estate investment have added to the pressure on China’s economy. The uncertain outlook for the banking crisis further complicates the situation, leaving the prospect for oil prices unclear. Traders are advised to closely monitor any further developments in the global economy and financial system to receive trading signals and adjust their investment strategies accordingly.
Oil prices are trading lower while currently testing the support level. However, MACD has illustrated diminishing bearish momentum, while RSI is at 52, suggesting the commodity might trade higher as technical correction since the RSI stays above the midline.
Resistance level: 73.50, 77.25
Support level: 68.60, 64.75

업계 최저 스프레드와 초고속 실행으로 FX, 지수, 귀금속 등을 거래하실 수 있습니다!
Please note the Website is intended for individuals residing in jurisdictions where accessing the Website is permitted by law.
Please note that PU Prime and its affiliated entities are neither established nor operating in your home jurisdiction.
By clicking the "Acknowledge" button, you confirm that you are entering this website solely based on your initiative and not as a result of any specific marketing outreach. You wish to obtain information from this website which is provided on reverse solicitation in accordance with the laws of your home jurisdiction.
Thank You for Your Acknowledgement!
Ten en cuenta que el sitio web está destinado a personas que residen en jurisdicciones donde el acceso al sitio web está permitido por la ley.
Ten en cuenta que PU Prime y sus entidades afiliadas no están establecidas ni operan en tu jurisdicción de origen.
Al hacer clic en el botón "Aceptar", confirmas que estás ingresando a este sitio web por tu propia iniciativa y no como resultado de ningún esfuerzo de marketing específico. Deseas obtener información de este sitio web que se proporciona mediante solicitud inversa de acuerdo con las leyes de tu jurisdicción de origen.
Thank You for Your Acknowledgement!